Alerts Log
Profinity 2.3 surfaces rule-generated alerts in the Alerts Log, in live indicators across the UI, and through the API. Users with the View alerts permission can view and acknowledge alerts and silence their actions. An alert's text, level, and links come from the rule that raised it.
Open Alerts Log
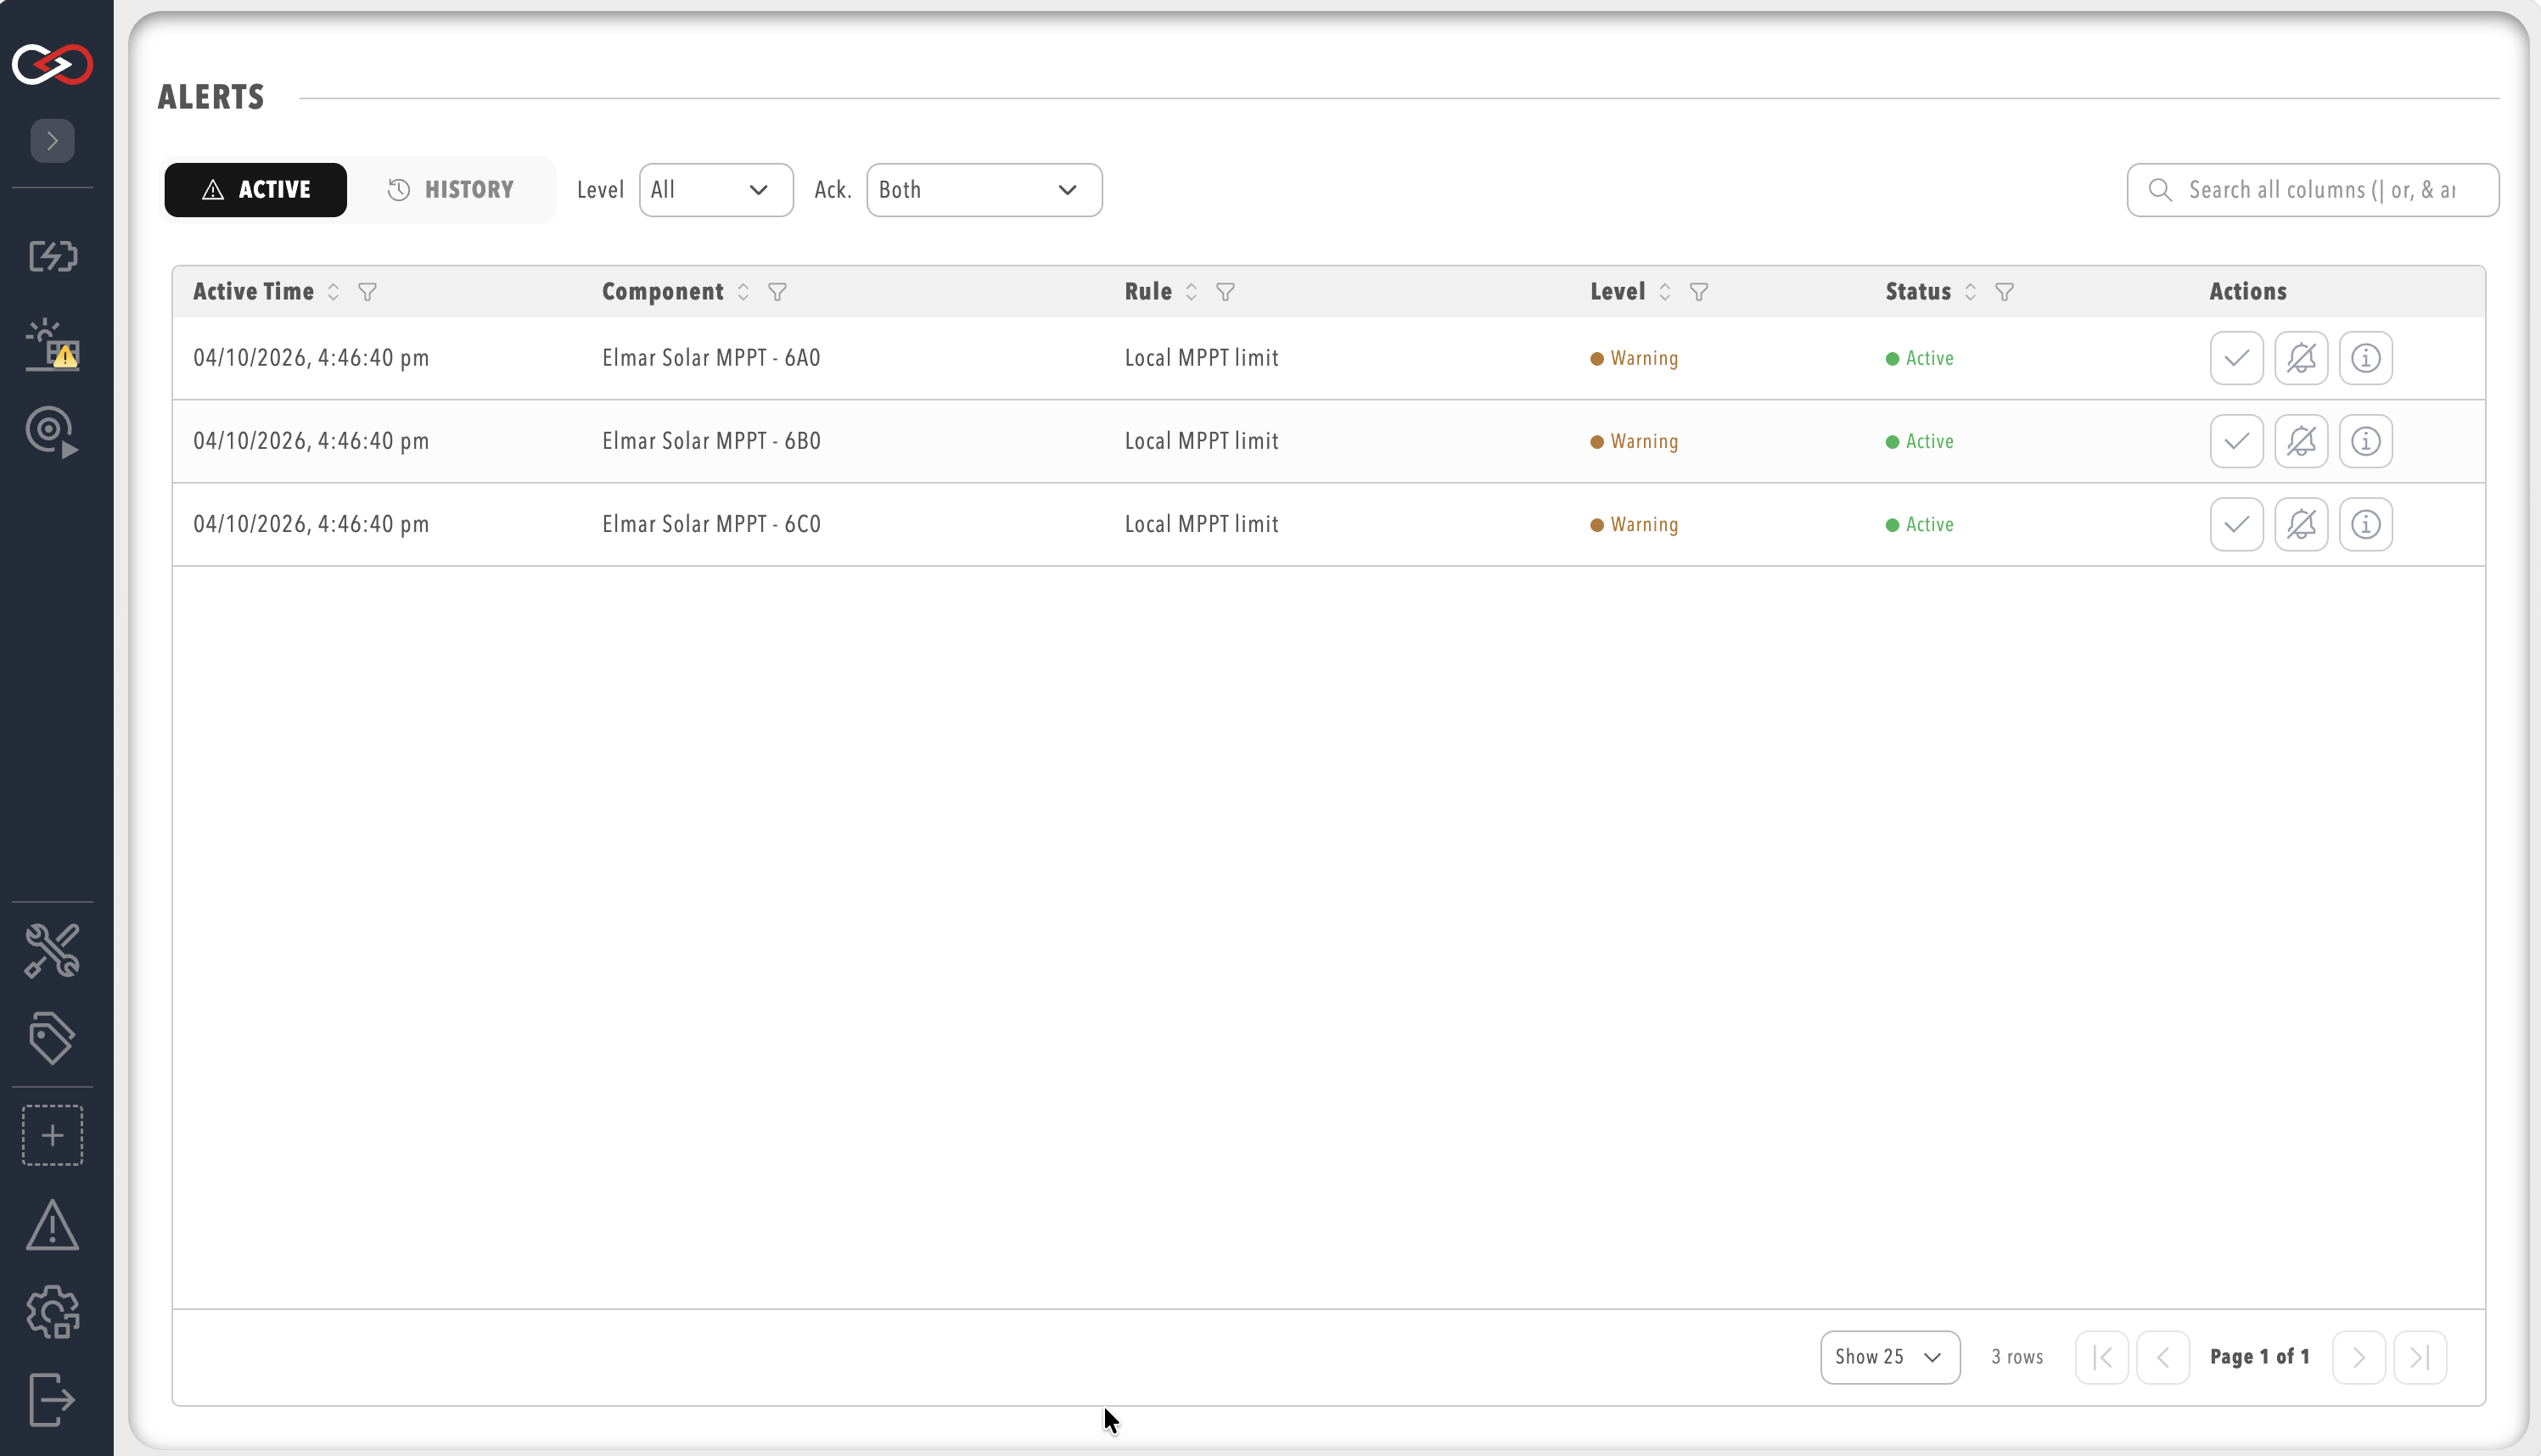
Select ALL ALERTS in the side menu to open the Alerts Log, which shows the page heading ALERTS.
Active and history tabs
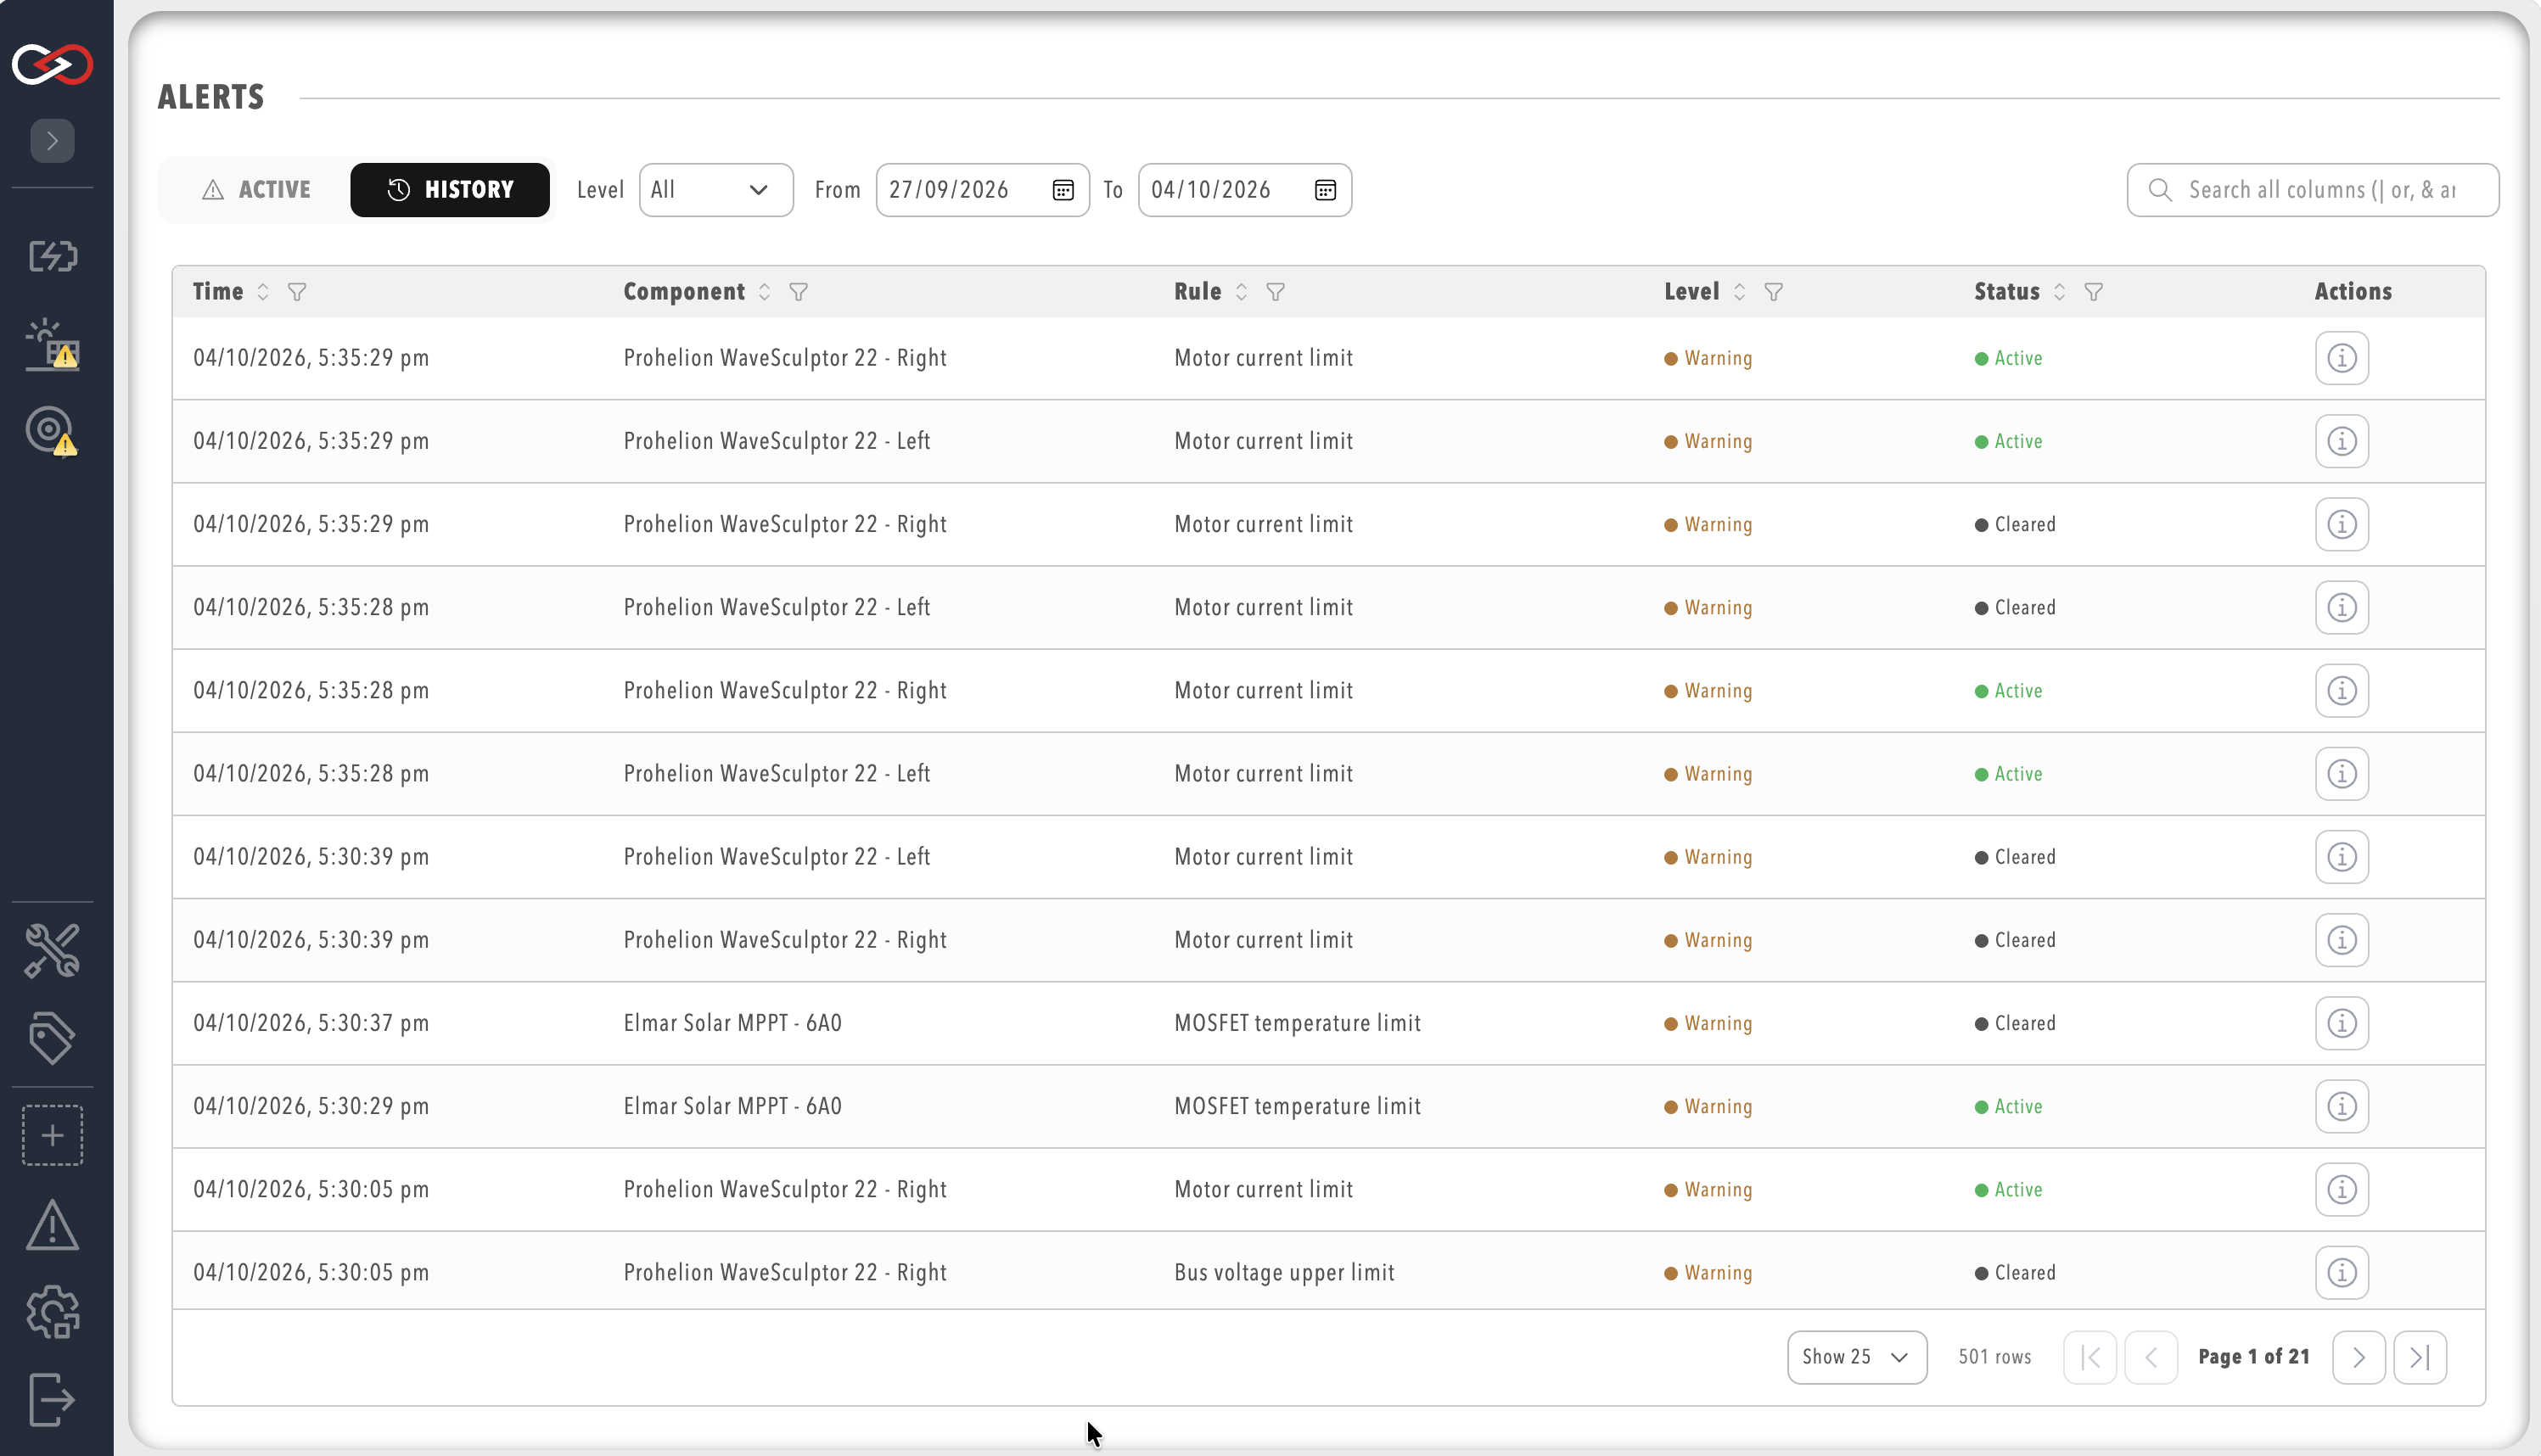
The Active tab shows rule alerts currently firing, and the History tab shows a paginated history, newest first. Both tabs show the time, the component, the rule, the level, the status, and an actions column. On the Active tab the time is labelled Active Time, which is when the current episode began.
Each row has a More info button that opens a detail dialog. The dialog shows the alert's message, tag, time, and status. It then shows these items from the rule, when the rule defines them:
- The related tag paths from the rule, under RELATED TAGS.
- The
description, which supports Markdown. - Any
moreInformationlinks under DOCUMENTATION.
Both tabs can be filtered by level. The Active tab can also be filtered by acknowledgement status, and the History tab has a date range. Tables show 25, 50, 75, or 100 rows per page, and 25 by default.
Alert levels
Set level on a rule, or on each threshold step, to classify alert severity.
The Alerts Log and the alert indicators combine the active rule state with that level.
The valid levels, from least to most severe, are Trace, Debug, Info, Warning, Error and Fatal.
Level names are not case-sensitive.
Information is accepted as Info and Warn as Warning, and a rule with no level is treated as Info.
An unrecognised level on a rule, threshold step, or triggerLevel skips that rule, and the log names it. The other rules in the file still load.
Correct the spelling and save again.
The same names are used as the triggerLevel of an action configured on a parent rule file or group.
A script reads the level from the RuleLevel property of its context object, as a string such as Warning.
The Webhook and MQTT JSON message has no level field, so add {RuleLevel} to the rule message if a receiver needs it.
The level filter on the Active and History queries is not case-sensitive.
Live indicators
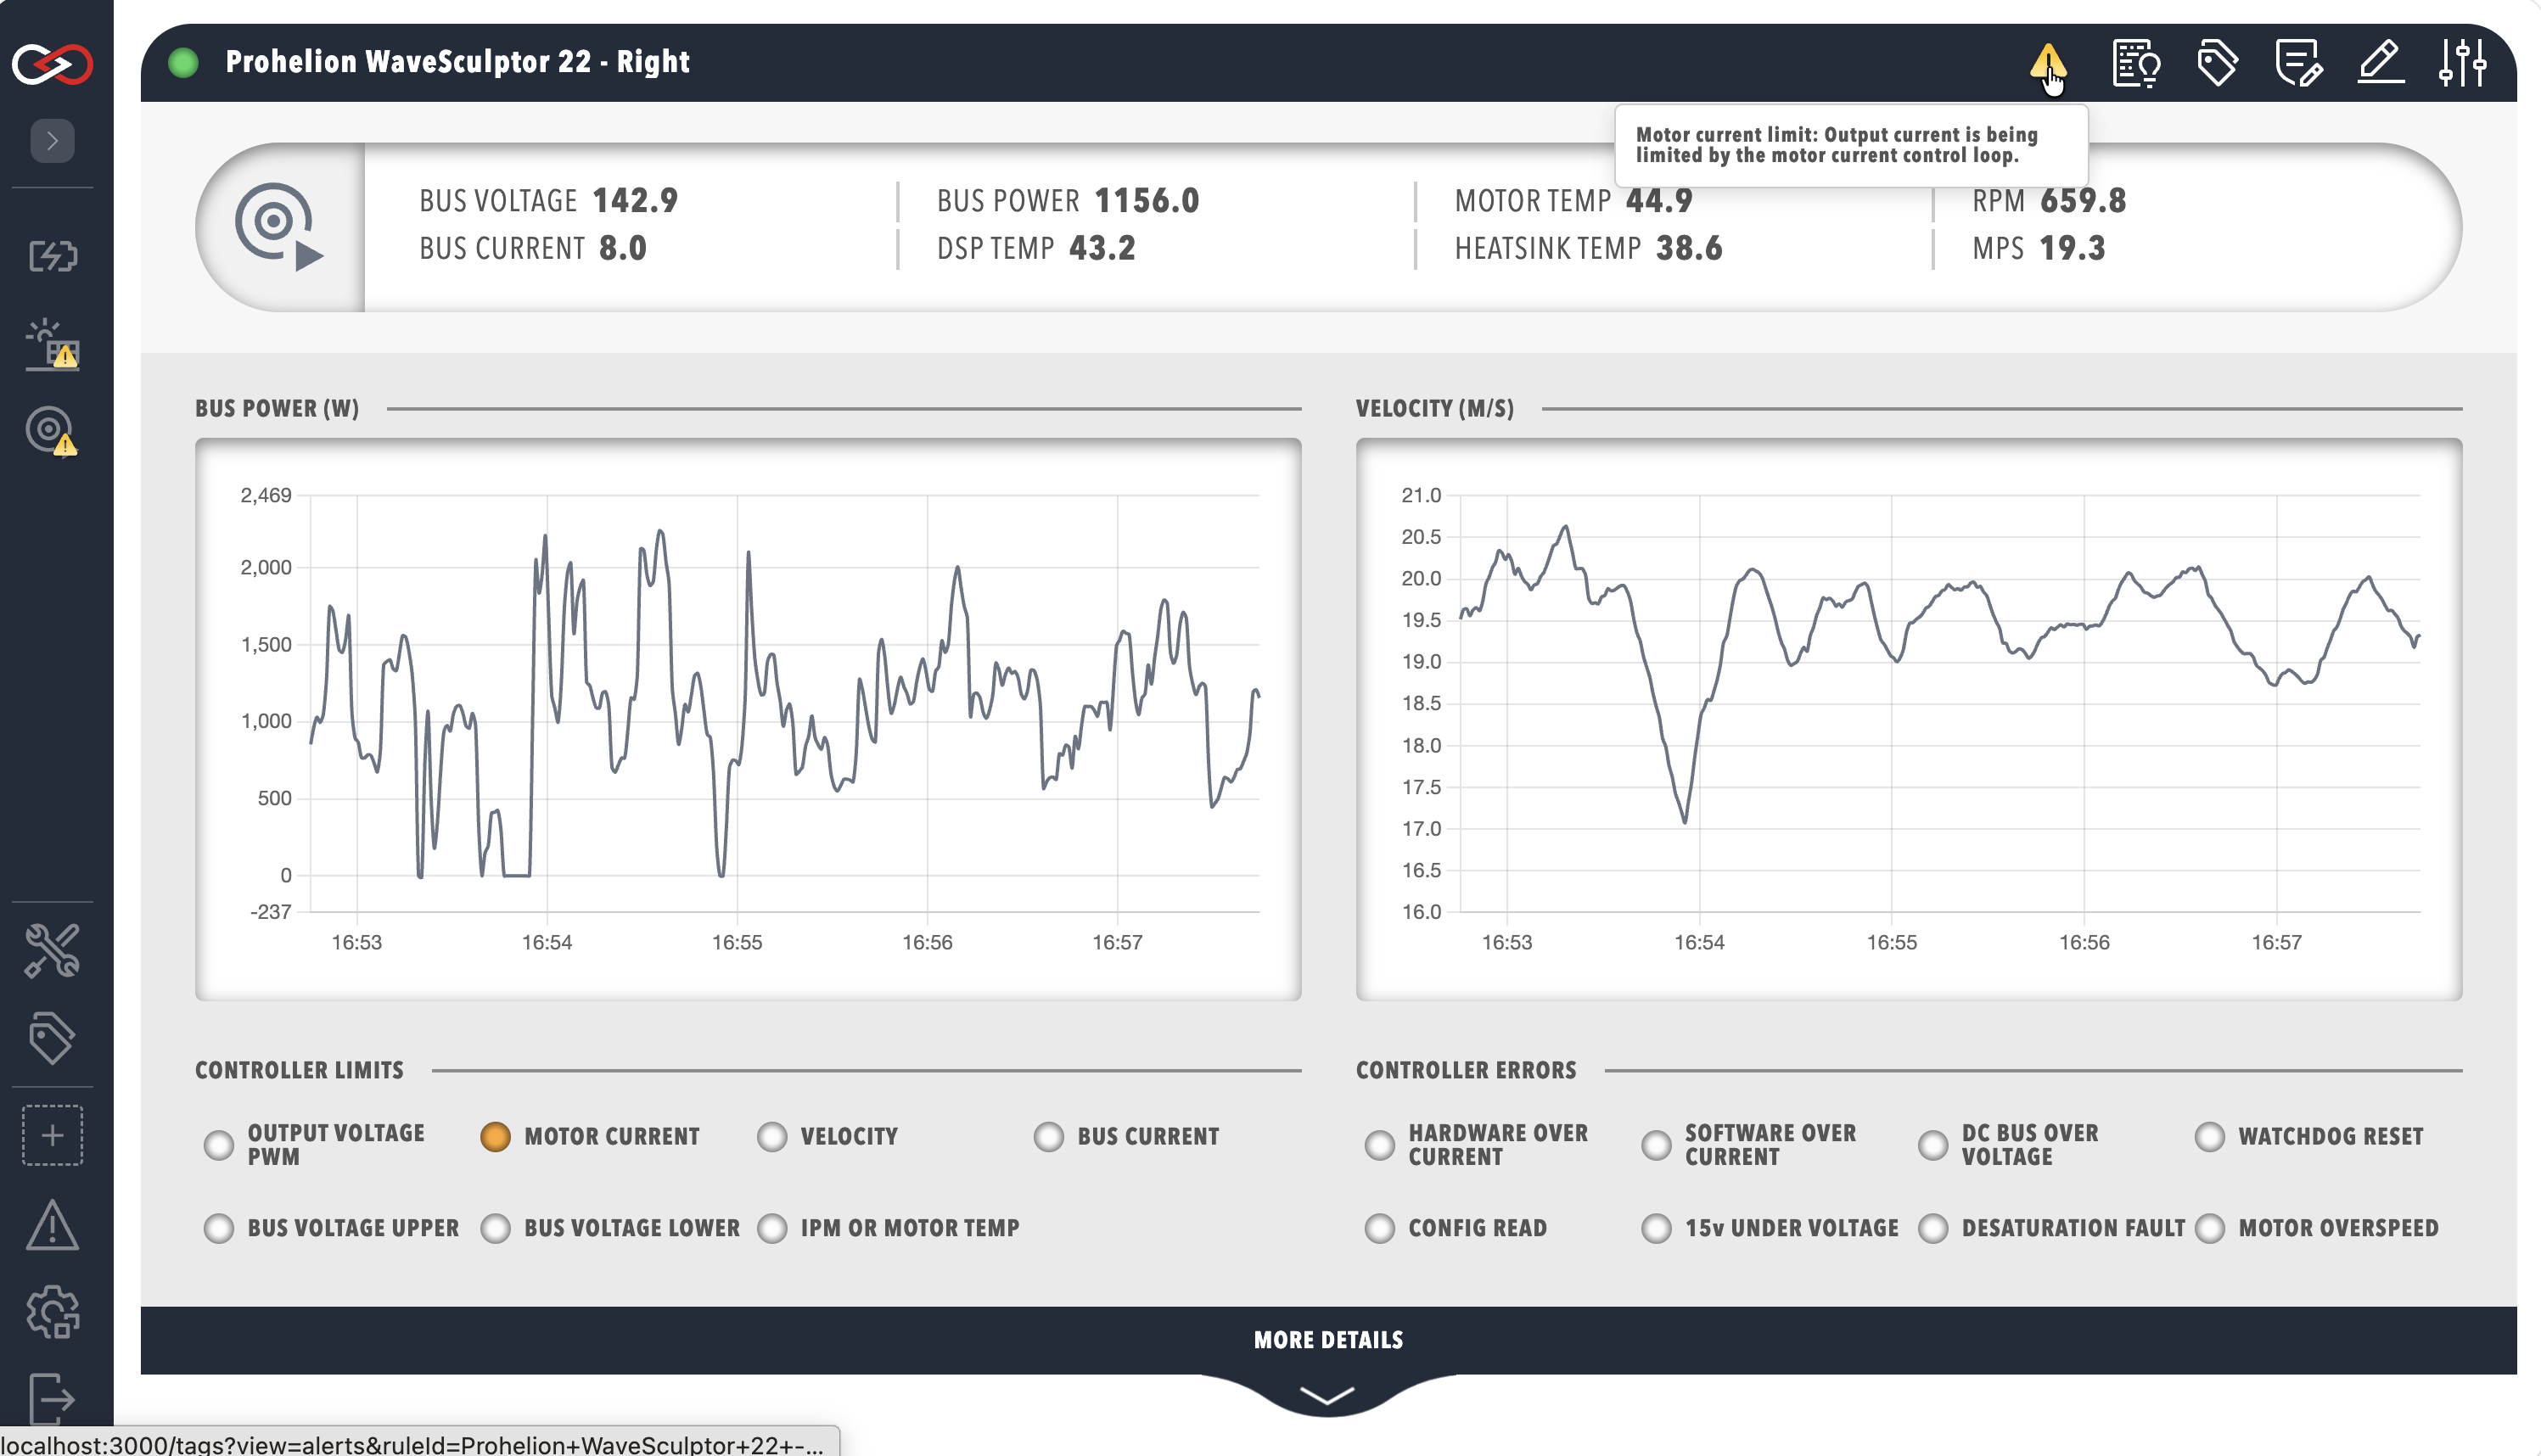
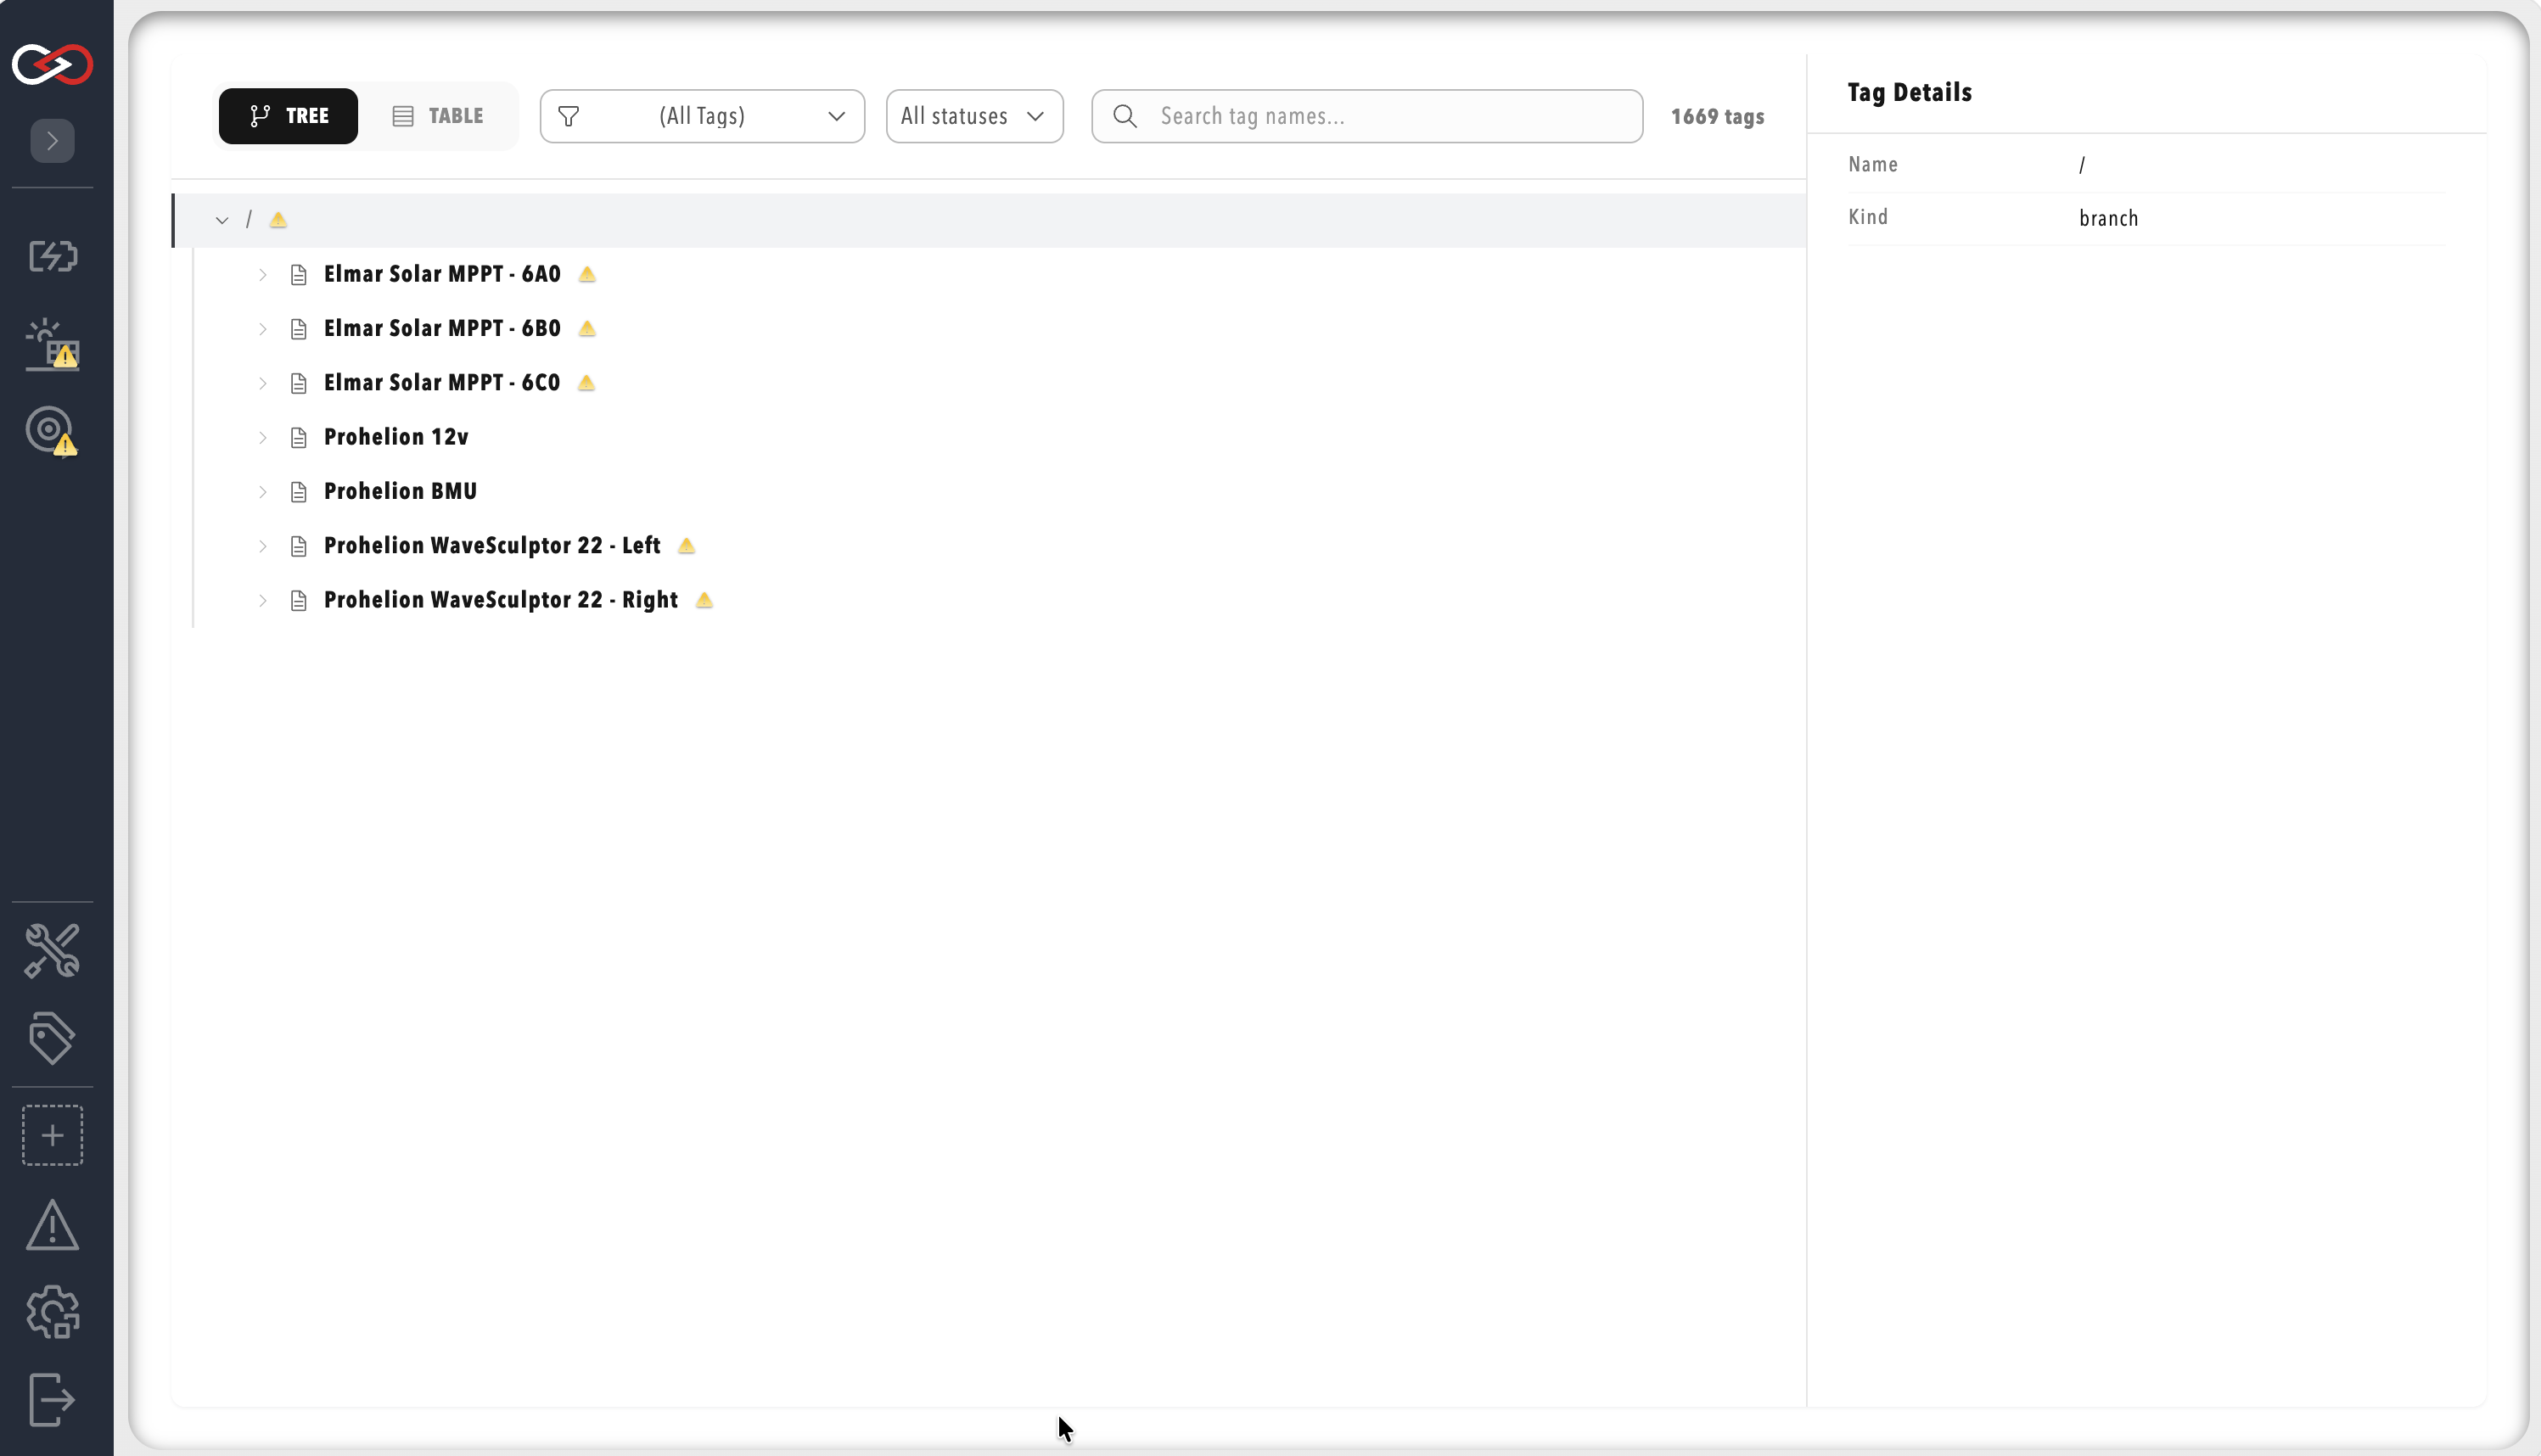
The web client polls active alerts every four seconds and shows a triangle for Warning and above:
- An amber triangle marks Warning.
- A red triangle marks Error or Fatal.
- The triangle sits at the bottom right of a dashboard widget, beside a tag in Tag Explorer, on a side-menu item, and on an image or 3D hotspot.
- Trace, Debug, Info, and an alert with no level do not show a triangle. Those alerts still appear in the Alerts Log.
- Where several alerts apply at once, the triangle follows the highest of those levels.
- The side menu highlights ALL ALERTS while any alert is active.
Hovering over an indicator shows a summary of the alert. Selecting it opens the Alerts Log when the user holds the View alerts permission. Stale data quality in Tag Explorer has its own icon, distinct from the alert triangle, so when both appear they indicate different conditions.
Acknowledge and silence
Acknowledging and silencing both need the View alerts permission, and both act on an alert that is currently active. The Acknowledge alert and Silence alert for 1 hour buttons sit in the actions column of the Active tab. An acknowledged alert shows an Unacknowledge alert button in place of Acknowledge alert.
Acknowledge marks the alert as seen and handled. It does not clear the alert.
Silence suppresses the actions of the rule for that alert, and it has these effects:
- No Email, Slack, Webhook, Message Queuing Telemetry Transport (MQTT), script, or log action runs.
- The alert stays active and visible, with a silence badge.
- The silence lasts one hour, and a silence expired entry then appears in the history.
- Actions that would have run during the hour are skipped, not queued or replayed. Actions run again only the next time the rule fires or clears.
- The silence lasts the full hour even if the alert clears first, so clear actions inside the hour are skipped as well.
- A new occurrence of the same alert inside the hour is still silenced.
How a rule is evaluated, including the Dwell seconds, Clear value (deadband) and Evaluation tick (seconds) settings, is described under Rule settings. The expression language is described in Tag expressions, and the actions a rule runs are described in Tag rules and Rule actions. For the rest of the tag layer, refer to Tag layer, Tag collections, and Roles and permissions.