How to add a component to your profile
Add a component to the active profile from the sidebar or homepage to monitor a CAN bus device, then check its status and connect it. You need Profinity running, an active profile, and the Modify components permission, which allows components to be added (Roles and permissions).
Some component types also need a licensed feature, such as a historian. A component type that is not licensed shows as unavailable. Licensing lists which features each edition includes.
A component shows data only when data arrives. For live data, add a protocol adapter first, because an adapter lets Profinity receive data from external systems. To see data from a CAN log alone, replay one as described in the Quick start guide.
For CAN bus networks, CAN bus adapters describes the supported adapters, including the Prohelion and Tritium CAN to Ethernet bridges. How to connect to CAN bus gives the steps. For industrial systems, Profinity also supports BACnet, EtherNet/IP, Modbus, Open Platform Communications Unified Architecture (OPC UA), and S7, described in Industrial protocols.
Add the component
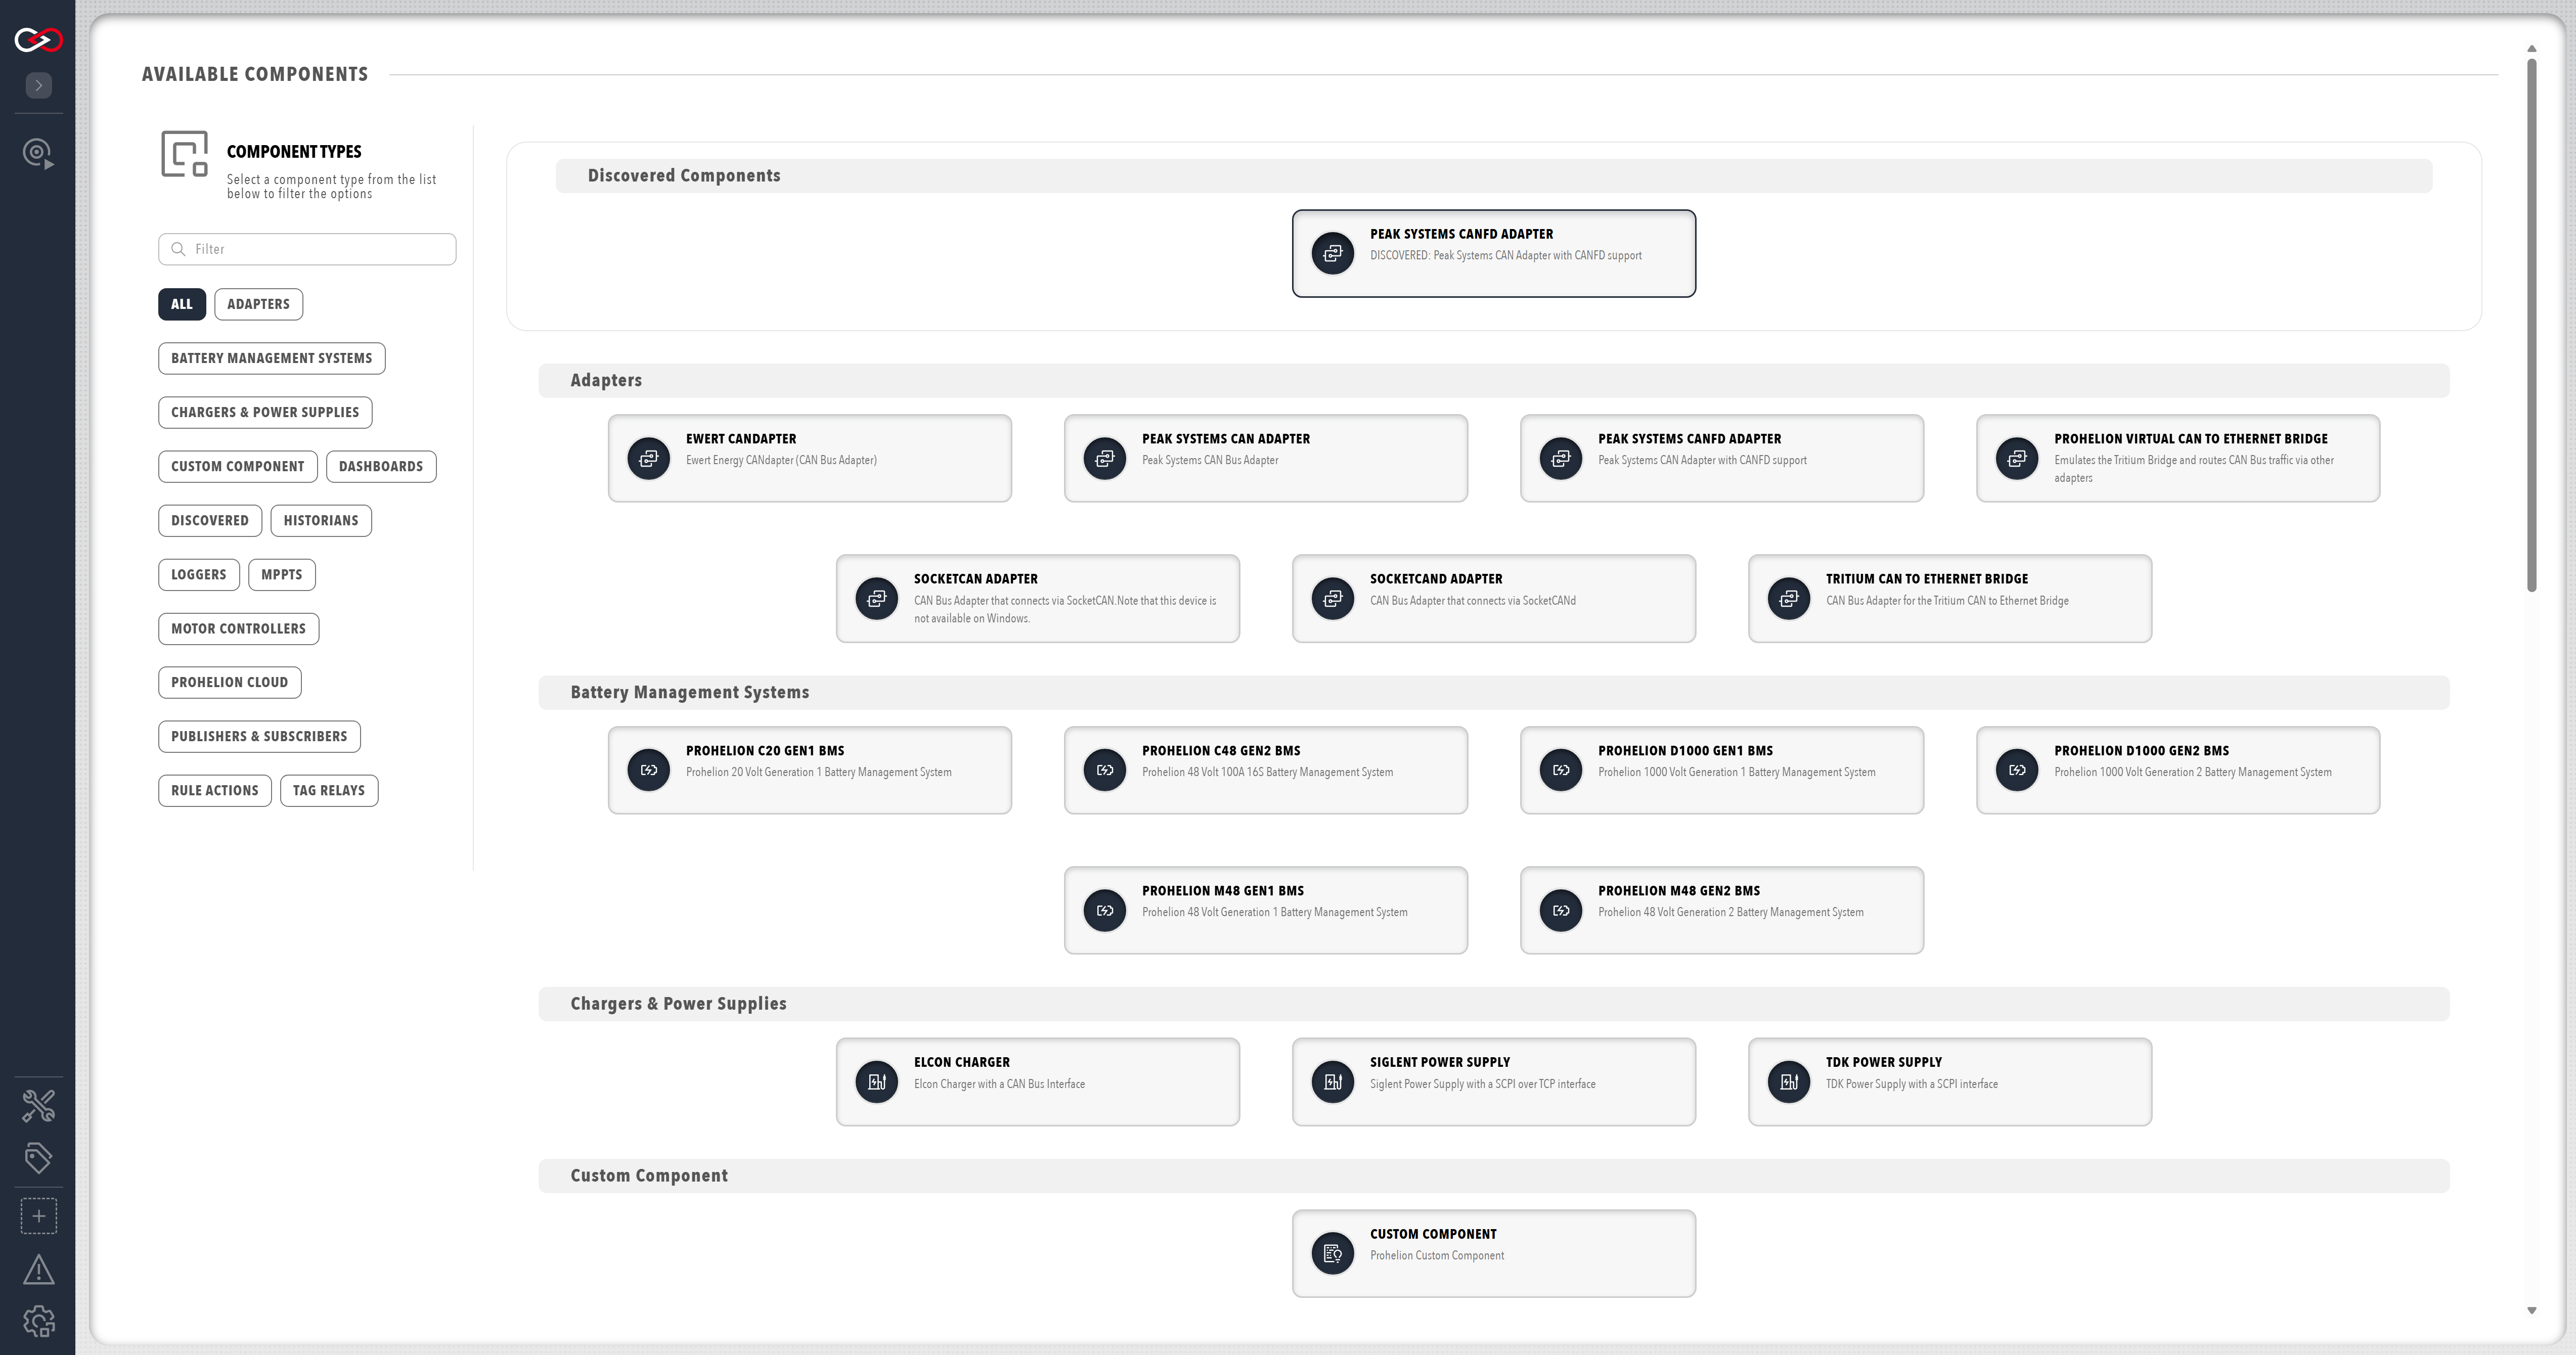
The ADD COMPONENT page groups the component types by category. The COMPONENT TYPES filter limits the list to one category:
- Adapters, including the CAN bus adapters, which are also shown at the top of the screen when discovered
- Battery Management Systems, Chargers & Power Supplies, Motor Controllers, and MPPTs, for devices such as:
- A Battery Management Unit (BMU).
- A motor controller.
- A Maximum Power Point Tracker (MPPT).
- Custom Component to create a new component
- Loggers (CAN File, TAG File, InfluxDB v1, and Prometheus)
- Historians (TAG Local, InfluxDB v2, InfluxDB v3, and TAG SQL)
- Publishers & Subscribers (Message Queuing Telemetry Transport (MQTT) and Webhook)
- Scripts, for scripts that run inside Profinity
To add a component:
- Select ADD COMPONENT on the homepage or at the bottom of the sidebar. The homepage tile is shown only when the home screen has Add Component turned on. A page opens that lists every component type that can be added, including hardware devices, data loggers, and custom scripts. Profinity can auto-discover some CAN bus adapters, and it shows a discovered adapter at the top of the page.
- Select the type to add.
Profinity prompts for these settings, and the settings that are specific to the component type differ for each component:
- A Component Name, which must be unique in the profile.
- A CAN ID or address, where the device needs one.
- The Auto connect setting, which starts the component automatically (explained after these steps).
- Select ADD COMPONENT at the bottom of the dialog. The button reads SAVE when you change the settings of an existing component. The component's icon appears in the sidebar.
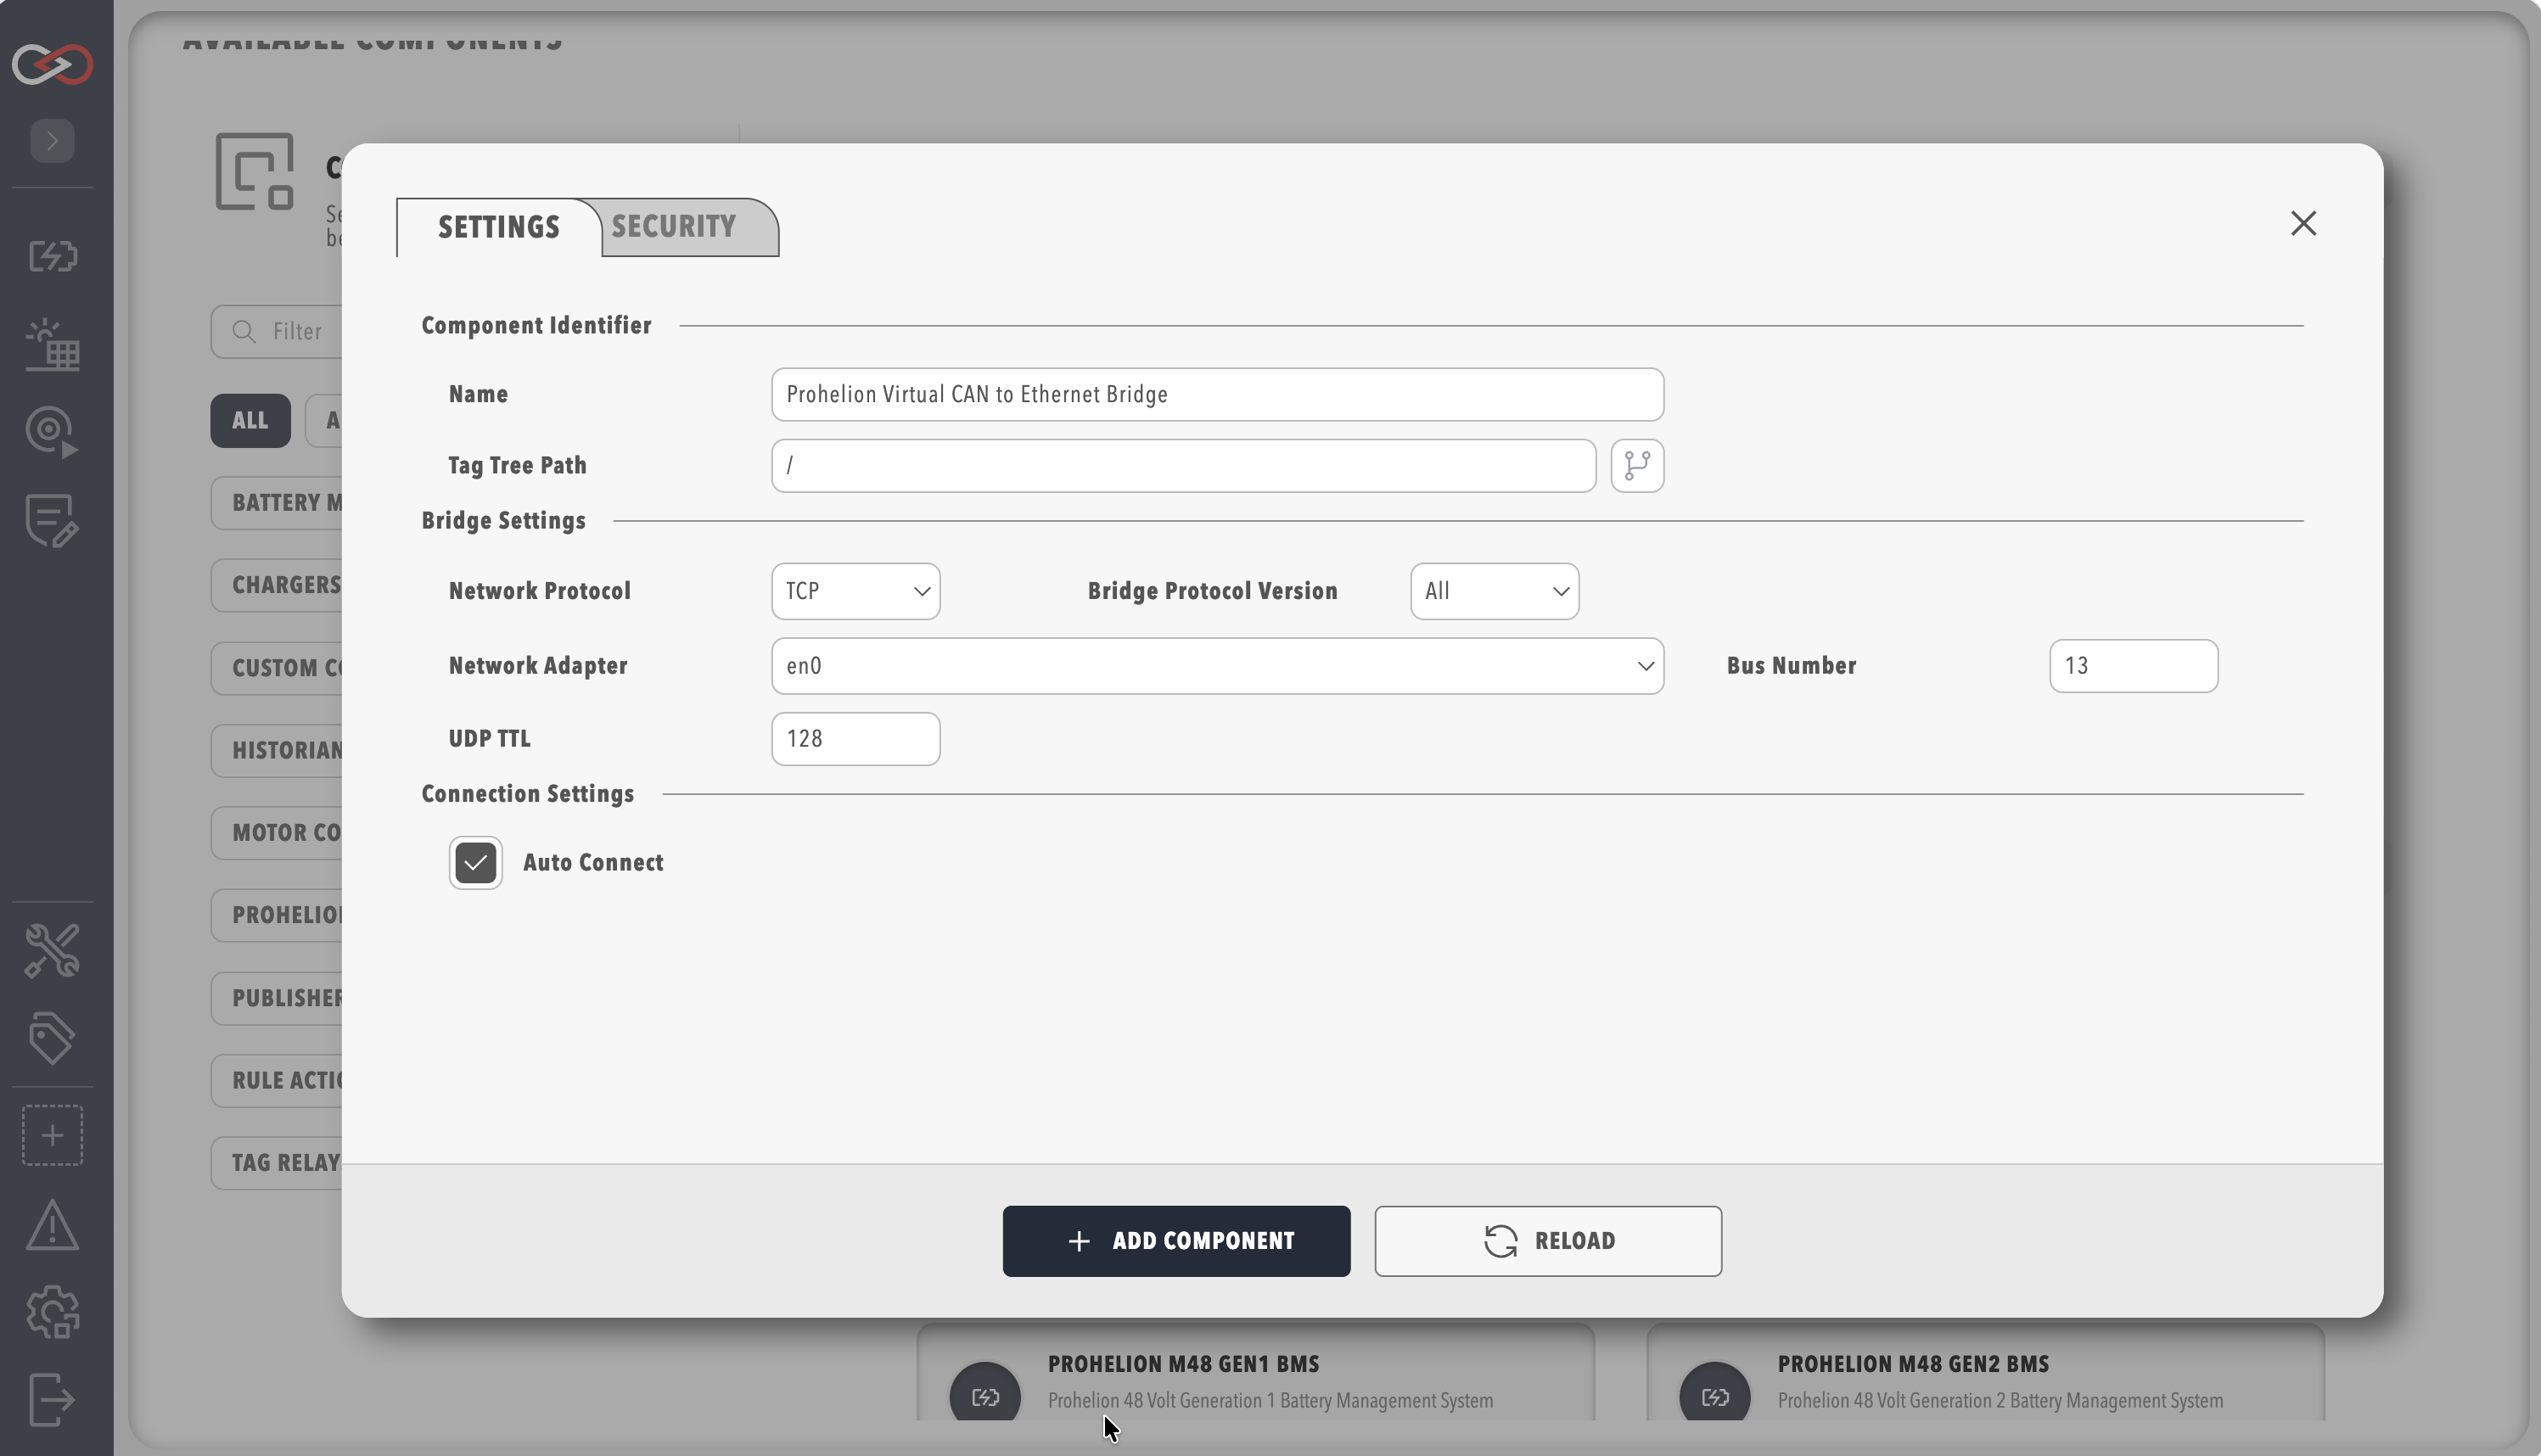
The start setting is Auto connect, which every component that connects to a broker, device, server, or database has, except the Elcon charger, and each component type has its own default, listed in Connections and reconnecting. With it on, the component connects when the profile loads. With it off, the component waits until you switch it on with its Connect or Start action, and it stays off until you do.
Hovering the mouse over a component icon in the sidebar presents a list of all devices associated with the current profile that match that component type. You can change the properties later by opening the Change Settings menu from the component's dashboard. The dedicated component pages describe the properties of each component and how to configure it.
Multiple components of the same type can be added to a profile, but each must have a unique name. Profinity refuses a device that listens on a range of CAN addresses if the range overlaps the range of another such device in the profile. Only one ThingsBoard Logger can be added to a profile. A Custom Component can also be limited to one instance in its metadata. If the name is already used in the profile, Profinity refuses the component and asks you to choose another name.
Check the component status
Each component has a coloured indicator on its icon that displays the operational status of the device.
| Colour | Status | Meaning |
|---|---|---|
| Green | On | The device is available, sending valid data and is in a valid state |
| Amber | Warning | The device is available, but is either not sending data or is in a warning state |
| Red | Error | The device is in an error state |
| Grey | Idle | The device is idle |
| Outlined, no fill | Off | The component is switched off, has not started, or is still making its first connection attempt |
| Empty (white) | N/A | The device is not available or cannot be contacted |
| What you see | Cause | What to do |
|---|---|---|
| A red indicator | The component is in an error state. | Check the logs. |
| The component stays red, or shows an empty lamp, after you add it | Usually, an adapter that is not connected. The CAN bus may also not be delivering data. | Refer to CAN bus adapter troubleshooting, which covers the usual causes and fixes for an adapter. |
| An outlined lamp | The component is switched off, has not started, or is still making its first connection attempt. | Check Auto connect, and start the component. |
Connect the component
A component that holds a connection, such as an adapter, shows a Connect button on its dashboard. A component that starts automatically needs no click. To connect the component:
- Select the component in the sidebar.
- Select Connect.
- Wait for the status to turn green, then confirm that data is appearing.
Remove a component
Deleting a component removes its settings from the profile and deletes its folder, which holds its dashboard, scripts, and other files. Deleting a local historian also deletes its history database. Log files from file and SFTP loggers stay on the device, and data in an external database or on a remote server stays where it is. To bring a deleted component back, import the profile pack that you downloaded before the deletion, as described in Import a profile pack. The import adds the pack as a separate profile, and it is refused while a profile with the same name exists, so give the pack file a name that no profile uses.
To remove a component that is no longer required:
- Download a profile pack, as described in Download a profile pack. The ZIP file holds the profile and its related files, including the component.
- Open the Change Settings menu item in the component dashboard menu. It shows the settings icon.
- Select DELETE COMPONENT at the bottom of the settings dialog, then confirm in the Delete component dialog. If rules use the component as an action, Profinity removes those actions from the affected rules.
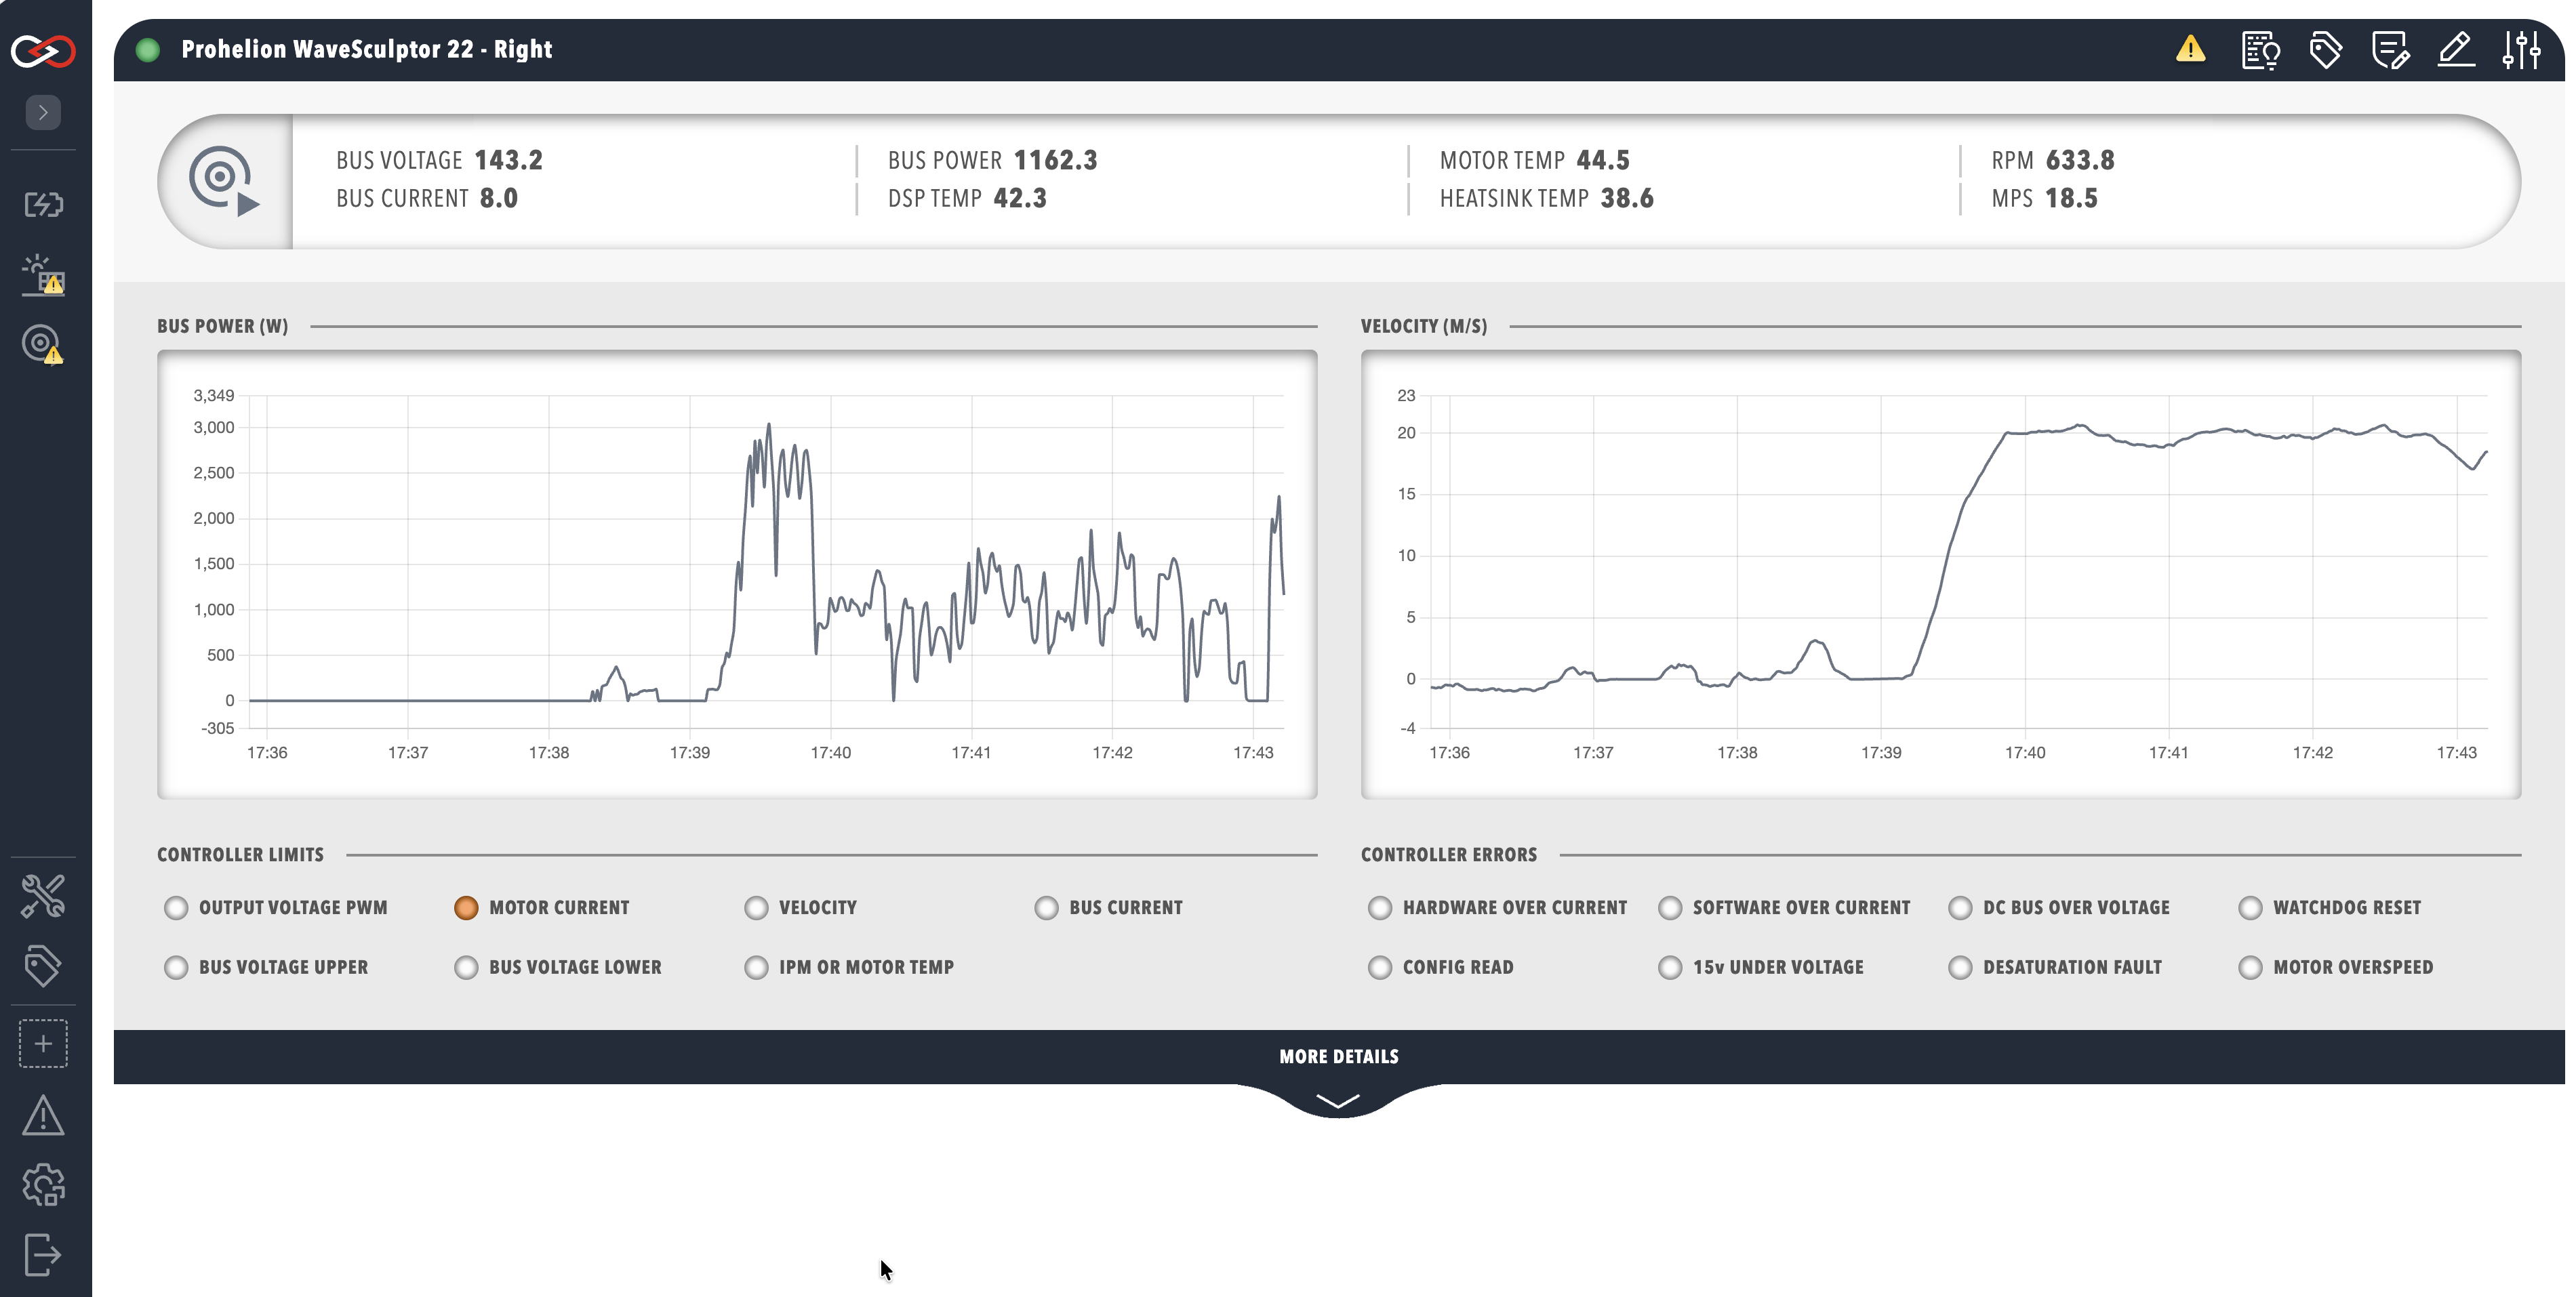
To see the data of the new component on a dashboard, refer to How to create a custom dashboard.