Tables
Data table display. Tables present structured data in rows and columns, with advanced features like heatmaps and highlighting for better data analysis.
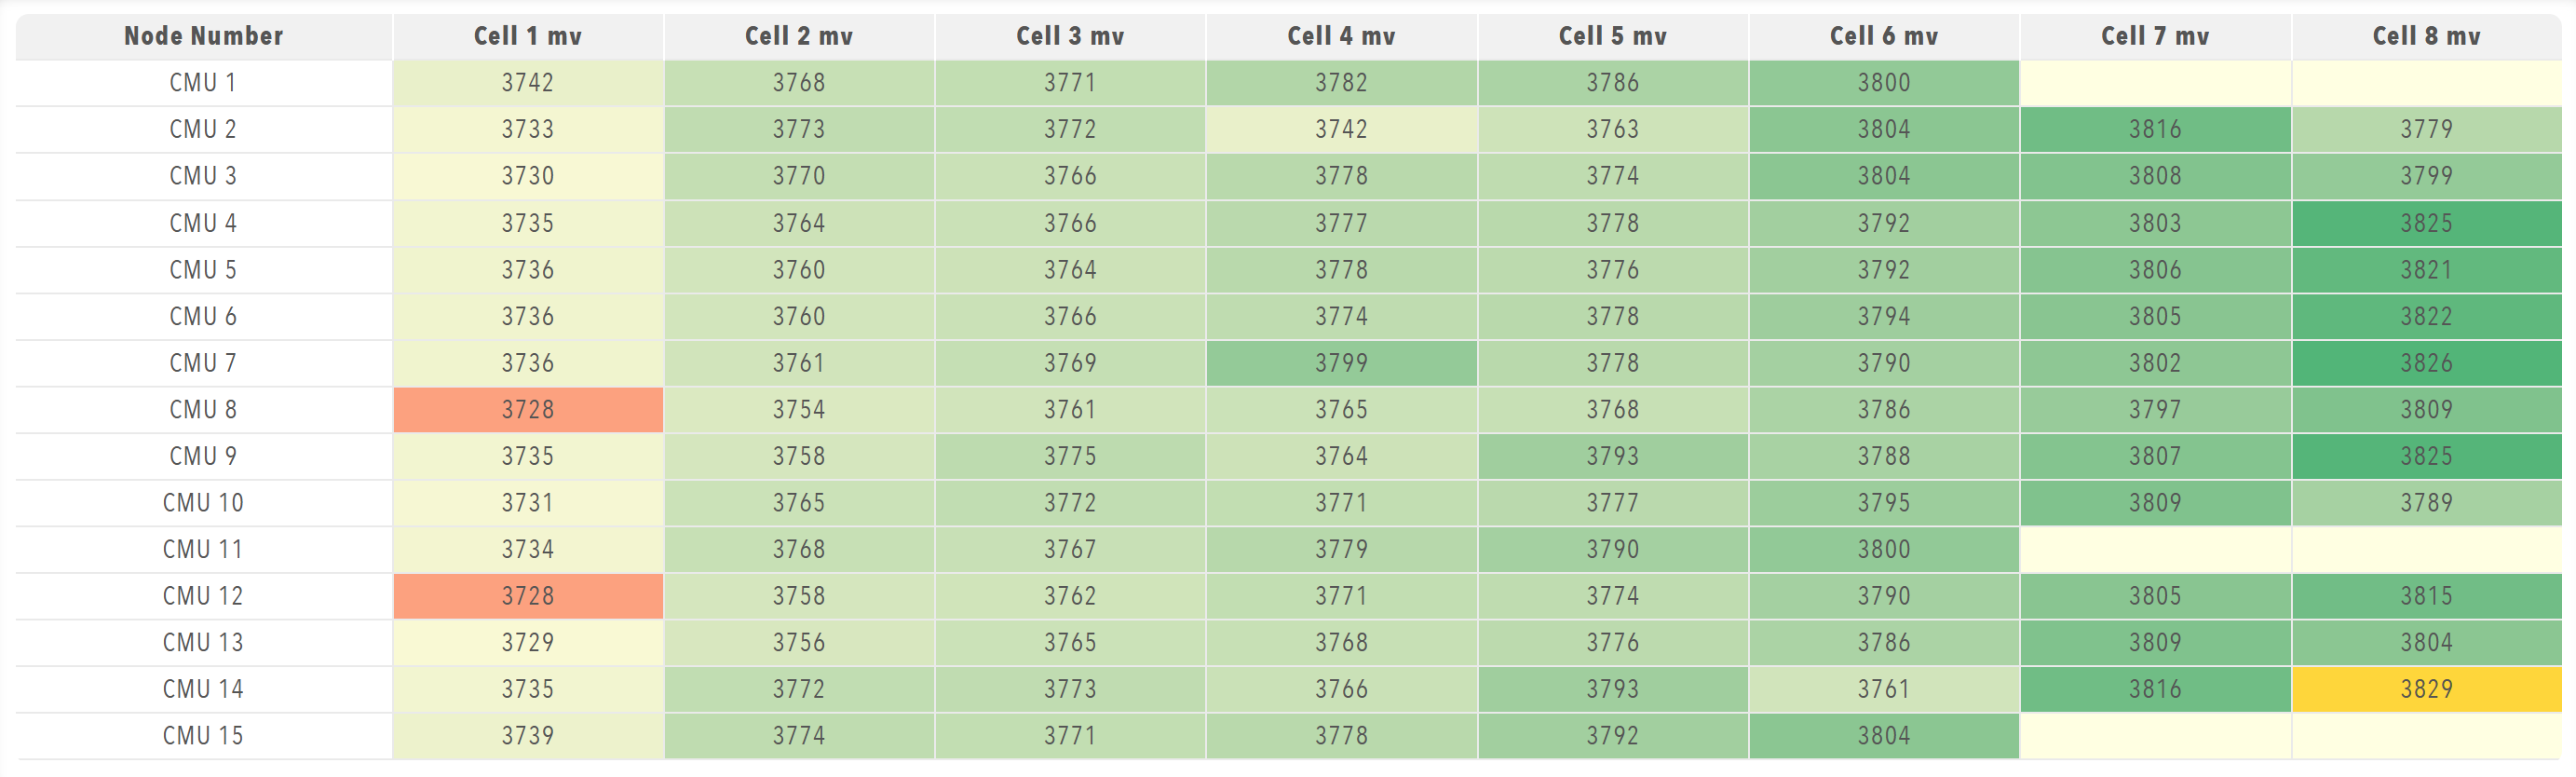
Best for: Structured data display, multi-dimensional data, data analysis, large datasets, comparative data
Parameters:
| Parameter | Type | Description |
|---|---|---|
id |
optional (string) | Unique identifier for the table |
class |
optional (string) | CSS class for styling |
label |
optional (string) | Display label |
tableHeaders |
required (array) | Column header configuration |
value |
optional (array) | Table data |
selectColumns |
optional (boolean) | Allow column selection |
minValueToDisplay |
optional (number) | Minimum value to display |
maxValueToDisplay |
optional (number) | Maximum value to display |
heatmap |
optional (boolean) | Enable heatmap visualization |
highlightMin |
optional (boolean) | Highlight minimum values |
highlightMax |
optional (boolean) | Highlight maximum values |
highlightAtOrBelow |
optional (number) | Highlight values at or below this threshold |
highlightAtOrAbove |
optional (number) | Highlight values at or above this threshold |
highlightIfEqualTo |
optional (number) | Highlight specific values |
alertAtOrBelow |
optional (number) | Alert for values at or below this threshold |
alertAtOrAbove |
optional (number) | Alert for values at or above this threshold |
alertIfEqualTo |
optional (number) | Alert for specific values |
displayPositive |
optional (boolean) | Display positive values only |
conversionFactor |
optional (number) | Conversion factor to apply to values |
precision |
optional (number) | Decimal precision for numerical values |
rowNames |
optional (array) | Optional array of row names for series data |
columnNames |
optional (array) | Optional array of column names for series data |
enabled |
optional (boolean) | Whether the table is enabled |
visible |
optional (boolean) | Whether the table is visible |
bind |
optional (array) | Data binding configuration |
Table Header Structure:
Each item in tableHeaders must contain a header object with:
| Parameter | Type | Description |
|---|---|---|
accessorKey |
required (string) | Key to access data in table rows |
value |
required (string) | Display label for the column header |
Example:
dashboard:
  items:
    - row:
        items:
          - table:
              tableHeaders:
                - header:
                    accessorKey: name
                    value: Node Number
                - header:
                    accessorKey: cell1mV
                    value: Cell 1 mv
                - header:
                    accessorKey: cell2mV
                    value: Cell 2 mv
              minValueToDisplay: 0
              heatmap: true
              highlightMin: true
              highlightMax: true
              highlightIfEqualTo: -32768
              displayPositive: true
              bind:
                - target: value
                  source: Prohelion BMU.[Property].PackData.Nodes.Values