Basic Usage
The core telemetry system can be accessed by going to
If the system is running you will see a page that looks like this.
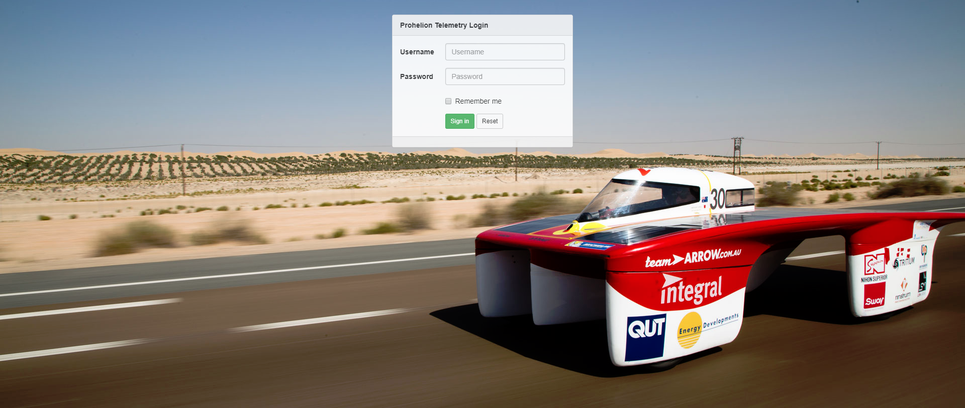
If you see the screen then you will able to log in with the default account
Username: admin
Password: passw0rd!
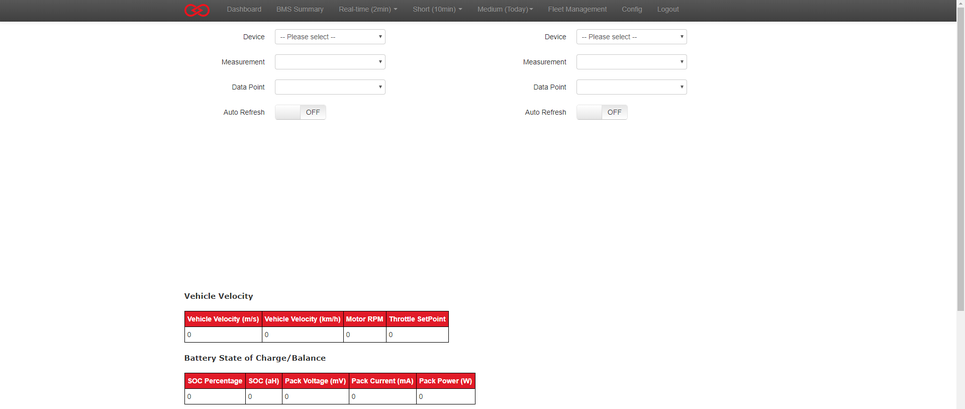
At which point you should be presented with the dashboard that looks like this.
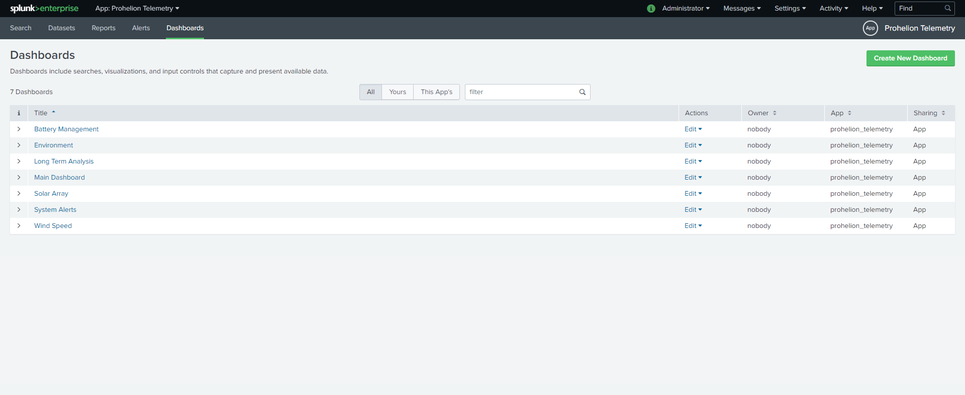
Splunk
Complex reporting is handled in the Telemetry system by splunk, which can be accessed by going to the url
If everything is running correctly, you should see a screen that looks like this
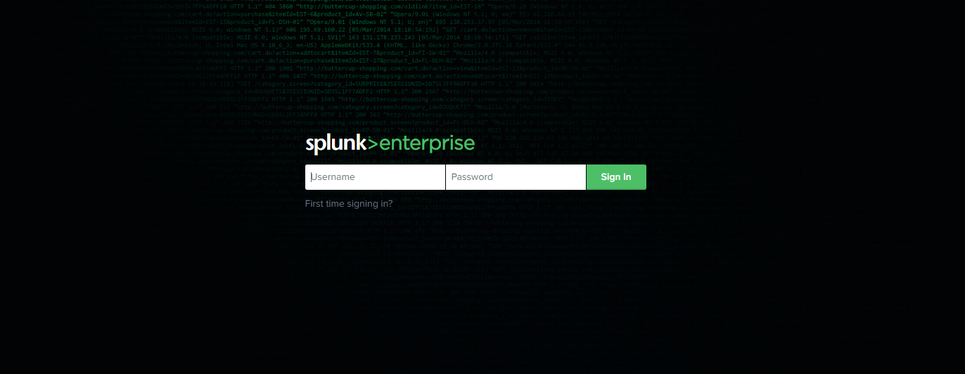
If you see the screen then you will able to log in with the default account
Username: admin
Password: passw0rd!
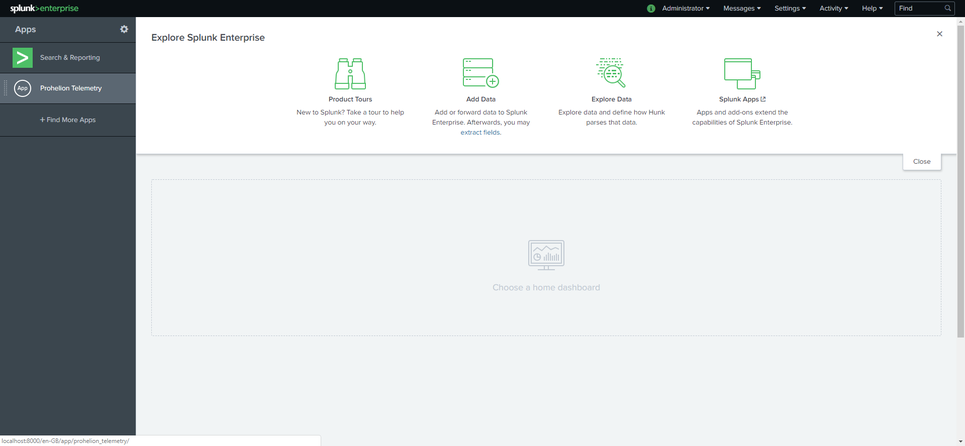
Click on the Prohelion Telemetry Application and then the Dashboards menu item to see that available reporting dashboards
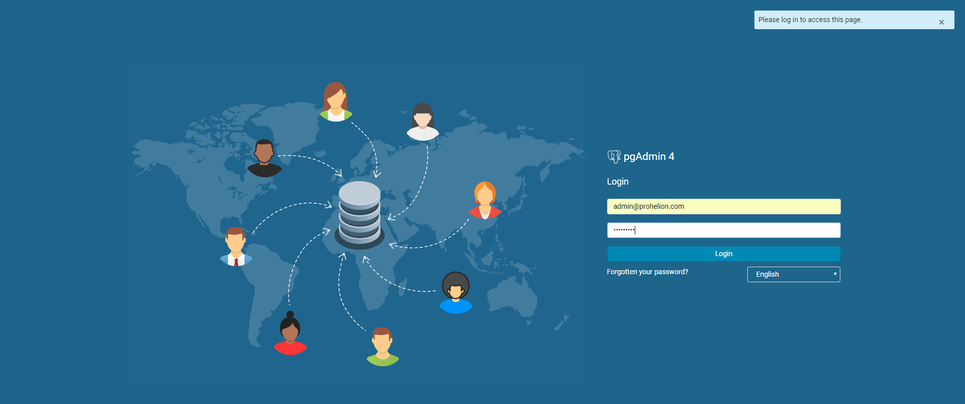
PgAdmin
PgAdmin allows you direct access to the underlying TimescaleDB (Postgres) database that runs the Telemetry System. You can access it on the URL
Click the menu on the left to display the available connections and then use the default accounts to connect to the database.
Username: admin@prohelion.com
Password: passw0rd!
Once you have logged in, connect to the database instance in the menu on the left and reenter the database password.
Password: passw0rd!
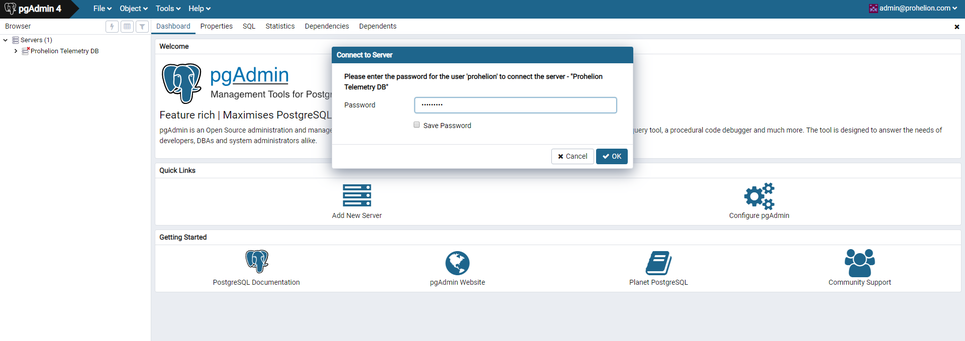
You are now connected to the database instance, the tables for the application are stored in the public schema.